Apaluma
CURRENTS 04FROM SCATTERED SIGNALS TO A SHARED VIEW

APALUMA CURRENTS 04 · A FIELD STUDY ON PUBLIC DATA

The river ends before the sea.

The Colorado drains 246,000 square miles across seven states and two countries, waters 40 million people and 5.5 million acres of farmland, and in most years no longer reaches the Gulf of California. Run the camera backwards from that dry channel — through Mead, through the Grand Canyon, through Powell — and you arrive at snow falling at 10,000 feet in the Rockies. This is the story of how a river that large runs out, and who is holding the ledger when it does.

BALANCE THE RIVER YOURSELF
246,000square miles of basin
40Mpeople served
5.5Macres irrigated
30federally recognized tribes
2countries

FRAMING NUMBERSCONGRESSIONAL RESEARCH SERVICEINTERNATIONAL BOUNDARY AND WATER COMMISSION

Cross-section of the Colorado River from Rocky Mountain snowfield to the dry deltaA left-to-right profile: snowpack in the Colorado Rockies feeds the headwaters, which fill Lake Powell behind Glen Canyon Dam. Below it the compact point at Lees Ferry, then the Grand Canyon, then Lake Mead behind Hoover Dam. Downstream the channel narrows through the Lower Basin and ends before reaching the Gulf of California. Both reservoirs show the mineral bathtub ring left by falling water.SNOWPACK10,000 FTLAKE POWELLGLEN CANYON DAMLEES FERRYTHE COMPACT POINTGRAND CANYONLAKE MEADHOOVER DAMCITIES · FARMSTHE DELTADRY IN MOST YEARS

FOLLOW THE WATER


01THE MECHANISM

Snow becomes a ledger.

Four handoffs turn a winter's snowfall into an accounting entry. Follow them in order and the arithmetic at the end is unavoidable.

01 · THE SNOW

The snow

Winter storage in the Rockies. The Colorado headwaters at La Poudre Pass, the Green in the Wind Rivers, the San Juan in the San Juans. Roughly 85 percent of the river's flow originates in the Upper Basin high country. The snowpack is the reservoir before the reservoirs.

MEASURED · method labelUSDA NATURAL RESOURCES CONSERVATION SERVICE
02 · THE MELT

The melt

The April-to-July runoff pulse. One season's snow is the entire year's supply. Warmer springs mean thirstier soils and a thirstier atmosphere take their cut before the river does — which is why a 60 percent snowpack does not produce 60 percent of a normal runoff.

FORECAST · method labelNOAA COLORADO BASIN RIVER FORECAST CENTER
03 · THE CAPTURE

The capture

Powell and Mead, the two largest reservoirs in the United States, together holding roughly four years of average flow when full. This is the plumbing that made the paper allocations feel real for a century.

MEASURED · method labelU.S. BUREAU OF RECLAMATION
04 · THE DIVISION

The division

Lees Ferry, Arizona. The compact point where one river becomes two basins on paper. The Upper Basin's obligation: not to deplete flows below 75 million acre-feet across any rolling ten years. This is where the accounting happens, and where the two basins do not agree on how to count.

PUBLIC RECORD · method labelLAW OF THE RIVER
MAF/YR ALLOCATED ON PAPER, 1922 ONWARD16.5-17.5
MAF/YR NATURAL FLOW AVERAGE, 2000-202012.558

7.5 million acre-feet to the Upper Basin, 7.5 to the Lower Basin, 1.5 to Mexico under the 1944 treaty. Against a river whose modeled natural flow at Lees Ferry has averaged 12.558 million acre-feet a year since 2000 — 17.5 percent below its own 20th-century mean of 15.224. The ledger promises more water than arrives, and it has for a quarter century.

SOURCELAW OF THE RIVERINTERNATIONAL BOUNDARY AND WATER COMMISSIONU.S. BUREAU OF RECLAMATION

02THE SIGNALS

The signals refuse a simple story.

Four readings on the same river, taken four different ways. Each carries the label for how it was produced, because a measurement, a model output, and a tree-ring reconstruction are not the same kind of fact.

17.5%BELOW THE 20TH-CENTURY MEAN

The river shrank while the paperwork held still

Modeled natural flow at Lees Ferry averaged 15.224 MAF/yr from 1906 to 1999 and 12.558 MAF/yr from 2000 to 2020. Both figures come from the same Reclamation dataset, computed the same way. The decline is not a forecast; it already happened.

MODELED · method labelU.S. BUREAU OF RECLAMATION
~9.3%FLOW LOST PER DEGREE C OF WARMING

This is not a drought that ends

Published attribution work finds that a large share of the decline is driven by temperature rather than precipitation shortfall: less reflective snow, more evaporation, thirstier soils. A drought ends when it rains. Aridification does not.

PUBLISHED SENSITIVITY RANGE6%12%
MODELED · method labelPUBLISHED RESEARCH
24.1%COMBINED POWELL + MEAD STORAGE · SNAPSHOT · PROVISIONAL

The two biggest reservoirs in the country, right now

Combined live storage as a share of combined capacity, read daily from Reclamation. When this piece was built the two reservoirs together held well under a third of what they can hold.

12.29 of 50.9 MAF of combined live capacity.

MEASURED · method labelU.S. BUREAU OF RECLAMATION
17.708MAF/YR · THE 1906-1930 BASELINE

The baseline was wrong from day one

The negotiators used the wettest stretch of the gage record available to them. Against a 1,244-year tree-ring reconstruction whose long-term mean is 14.655 MAF/yr, the years the compact was built on were an outlier — not a normal from which to divide a river.

RECONSTRUCTED · method labelNOAA PALEOCLIMATOLOGY / TREEFLOW

Card D is the yardstick problem in one number, and Section 05 puts twelve centuries behind it.

03THE TURN

A compact met a century.

Two columns, a hundred years apart, describing the same river. Status verified as of 2026-08-11.

1922 · THE NUMBER THEY USED

Seven states divided a river they had watched for eighteen years.

The Colorado River Compact split the basin at Lee Ferry and apportioned 7.5 million acre-feet of beneficial consumptive use to each half, with a further 1.5 million later guaranteed to Mexico by treaty. The gage record they relied on ran from 1906 and happened to cover one of the wettest stretches in twelve centuries.

  • Seven states were at the table. Mexico was not, and would wait 22 years for a treaty.
  • Thirty federally recognized tribes were not at the table either, despite rights confirmed by the Supreme Court in 1908 that are senior to every state compact.
  • The negotiators assumed surplus. The arithmetic only closes if the river delivers more than it has delivered in any 25-year window since.

SOURCELAW OF THE RIVERINTERNATIONAL BOUNDARY AND WATER COMMISSION

THE CENTURY THAT ARRIVED

The driest multi-decade stretch in the reconstructed record.

Since 2000 the basin has run a sustained deficit against its own allocations. The tree-ring record shows the deep past held droughts as severe — the driest 25-year window in the reconstruction, 1130 to 1154 CE, averaged 12.621 MAF/yr. That is the point: the gage era the compact was built on was the anomaly, and a drier river is the normal the basin never planned for.

  • 2000-2020 natural flow averaged 12.558 MAF/yr against allocations of roughly 16.5 to 17.5.
  • Lake Mead has operated in a declared shortage condition every year since 2022.
  • From 2020 through 2025, Lower Basin drought-plan contributions were required whenever Mead fell below 1,090 feet.

SOURCEU.S. BUREAU OF RECLAMATIONNOAA PALEOCLIMATOLOGY / TREEFLOWU.S. BUREAU OF RECLAMATION

The 2026 sequence

  1. The 2007 Interim Guidelines, the 2019 Drought Contingency Plans, and the related Minute agreements with Mexico all expire. Everything that has governed shortage on this river for two decades runs out at once.

    PUBLIC RECORD · method labelU.S. BUREAU OF RECLAMATION
  2. The seven basin states miss the consensus deadline for a state-negotiated replacement. The decision reverts to the federal process.

    PUBLIC RECORD · method labelU.S. BUREAU OF RECLAMATION
  3. The Lower Division States submit a shortage-distribution proposal. Reclamation's modeling assumptions for 2027-2028 reflect it.

    PUBLIC RECORD · method labelU.S. BUREAU OF RECLAMATION
  4. Reclamation publishes the Post-2026 Final EIS. The Preferred Alternative is not a fixed rulebook but an adaptive decision framework for operating years 2027 through 2036, implemented in two-year intervals within defined operational sideboards: Powell releases between 5.0 and 12.0 MAF, and Lower Basin shortages up to 3.6 MAF including assumed reductions to Mexico.

    PUBLIC RECORD · method labelU.S. BUREAU OF RECLAMATION
  5. Shortages up to 1.5 MAF are distributed under the Lower Division States' proposal; anything beyond that is distributed by priority. Consultation is triggered if projected Mead elevation falls below 1,000 feet, or projected Powell elevation below 3,500 feet.

    PUBLIC RECORD · method labelU.S. BUREAU OF RECLAMATION

The distance between the promise and the river is no longer a projection. It is a published federal decision with a two-year clock on it. What remains genuinely open is who absorbs the reduction — and whether the states agree before the priority system decides for them.

VERIFY BEFORE PUBLISH: as of this build no interstate Compact suit had been filed. An original-jurisdiction action between states would go directly to the U.S. Supreme Court. Do not sharpen this line beyond the filed record.


04LIVE PULSE

The river, right now.

Four readings that update on their own schedules, each shown against the threshold that makes it mean something. One place at one time is not the season.

LAKE MEADSNAPSHOT · PROVISIONAL
1,040.09FEET ·

POOL ELEVATION

Elevation is how the Lower Basin's shortage tiers are written, so this one number sets deliveries for Arizona, California, and Nevada.

FULL POOL1,229 FT
LEVEL 1 SHORTAGE1,075 FT
MINIMUM POWER POOL950 FT
DEAD POOL895 FT
MEASURED · method labelU.S. BUREAU OF RECLAMATION
LAKE POWELLSNAPSHOT · PROVISIONAL
3,520.72FEET ·

POOL ELEVATION

Below 3,490 feet the turbines stop, and Glen Canyon Dam may be unable to deliver its specified annual release through the river outlet works alone.

FULL POOL3,700 FT
DCP TARGET3,525 FT
MINIMUM POWER POOL3,490 FT
DEAD POOL3,370 FT
MEASURED · method labelU.S. BUREAU OF RECLAMATION
LEES FERRYSNAPSHOT · PROVISIONAL
8,380CUBIC FEET PER SECOND ·

DISCHARGE

The compact gage. This is regulated release from Glen Canyon Dam — what the dam let out today — not the river's natural flow.

STATUSPROVISIONAL
GAGEUSGS 09380000

Regulated release from Glen Canyon Dam, not natural flow.

MEASURED · method labelU.S. GEOLOGICAL SURVEY
UPPER COLORADO SNOWPACKSNAPSHOT · PROVISIONAL
66PERCENT OF MEDIAN ·

SNOW WATER EQUIVALENT

Meaningful roughly November through June. Outside that window this card shows the last season's peak and says so, because summer snowpack is not a signal.

SEASONNOV-JUN
NETWORK~200 SITES

Out of season (meaningful roughly November-June). Showing the water year 2026 peak from 114 reporting sites.

MEASURED · method labelUSDA NATURAL RESOURCES CONSERVATION SERVICE

HOW THIS UPDATES · Regenerated on every production build. Reservoir values update daily at the source; USGS discharge every 15 minutes; NRCS SWE daily. A snapshot older than its source cadence is labeled stale on the page. Reservoir elevation and storage and the Lees Ferry gage are re-read in your browser on load with an eight-second budget each; a feed that misses it leaves that one card on its dated snapshot and changes nothing else. Snowpack is a build-time reading because the authoritative basin index takes far longer than that budget allows.

TODAY ≠ THE TREND

A wet week does not repay a twenty-year overdraft. Today's elevation is weather; the direction across a decade is the story. Both numbers are real, they answer different questions, and only one of them is being negotiated.

05THE YARDSTICK

Twelve centuries, one river.

Tree rings put the instrumental record in its place. The reconstruction below runs from 762 CE to 2005, overlaid with the modeled natural-flow record from 1906. Two things become obvious at this scale: the years the compact was built on were unusually wet, and the deep past was drier than the gage era ever showed.

Reconstructed Colorado River flow at Lees Ferry, 762 to 2020A twenty-five year running mean of tree-ring reconstructed water-year flow from 762 to 2005 CE, overlaid with the modeled natural-flow record from 1906 to 2020. The reconstruction long-term mean is 14.65 million acre-feet per year. The 1906 to 1930 window used to set the 1922 compact allocations is shaded and sits well above that mean, while the post-2000 period sits well below it.5101520MAF1,244-YEAR MEAN 14.65 MAF1906-1930 COMPACT BASELINE1130-1154 DRIEST 25 YRS800100012001400160018002000
RECONSTRUCTED · 25-YR MEANMODELED NATURAL FLOW · 25-YR MEAN1906-1930 COMPACT BASELINE1130-1154 DRIEST 25 YEARS
Reconstructed water-year flow at Lees Ferry, 762-2005 CE, smoothed to a 25-year running mean so multi-decade behaviour is legible; the annual series is far noisier than any line at this width can honestly draw. The shaded band marks the 1906-1930 window used to set the 1922 allocations. Reconstructed values carry substantially wider uncertainty than instrumental ones, and the instrumental series is itself modeled rather than measured.

One year is weather. A century is the yardstick. The compact used two decades, and they were the wrong two.

06THE JOURNEY

Nine handoffs from snow to sea.

Water changes custody nine times between a Rocky Mountain snowfield and the Gulf of California. At every handoff something is measured, something is inferred, and something is invisible.

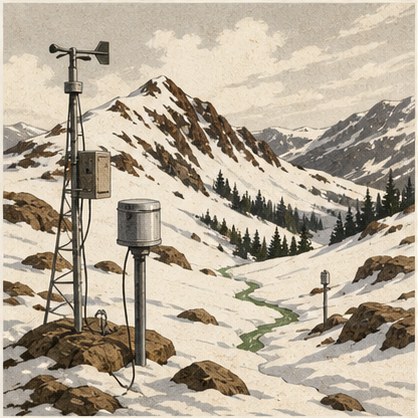
  1. Screen-printed panel: an automated snow-measurement station — anemometer mast, instrument cabinet and snow pillow on a steel frame — standing in a deep snowfield on a high alpine slope, with conifers and bare ridgelines above.
    01 · SNOW

    Handoff 01: Snow

    Roughly 200 SNOTEL sites weigh the Upper Basin snowpack all winter.

    MEASURED · method labelUSDA NATURAL RESOURCES CONSERVATION SERVICE
    OBSERVED

    Snow water equivalent at automated sites, daily through the accumulation season.

    REVEALS

    How much water is standing in the mountains before any of it moves.

    NOT IN FRAME

    Dust-on-snow events, which darken the surface and accelerate melt weeks early. The gauge sees the water, not the dust.

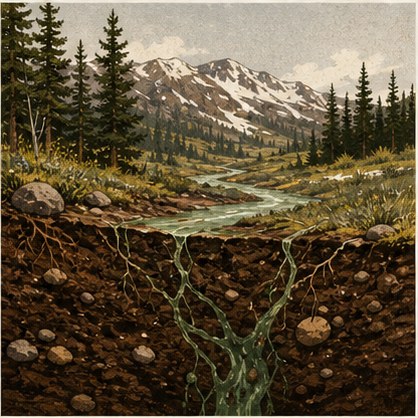
  2. Screen-printed panel: a cutaway through a spring meadow below melting snowpack, showing green meltwater threading down into the soil and cobble layers underground before any of it reaches a stream.
    02 · MELT

    Handoff 02: Melt

    The forecast centre converts snow into an expected April-July runoff volume.

    FORECAST · method labelNOAA COLORADO BASIN RIVER FORECAST CENTER
    OBSERVED

    Seasonal water-supply forecasts against climatology, updated monthly.

    REVEALS

    That the snow-to-runoff conversion is not fixed — it depends on how thirsty the ground is.

    NOT IN FRAME

    The soil-moisture deficit that consumes runoff before it reaches any gage. In 2021 a snowpack near 80 percent of median produced roughly 30 percent of median runoff.

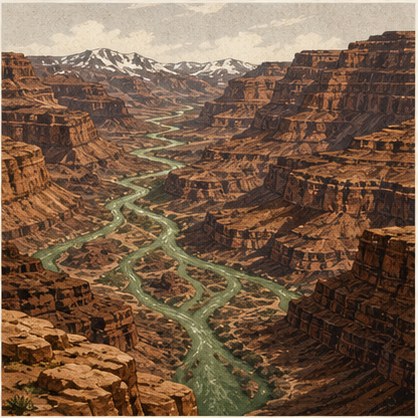
  3. Screen-printed panel: an aerial view of braided green river channels gathering out of side canyons and joining a single mainstem between layered red sandstone walls, with snow-capped peaks on the horizon.
    03 · HEADWATERS

    Handoff 03: Headwaters

    The Colorado, the Green, and the San Juan gather the high country.

    MEASURED · method labelU.S. GEOLOGICAL SURVEY
    OBSERVED

    Mainstem and tributary gages across the Upper Basin.

    REVEALS

    That roughly 85 percent of the entire river's supply originates above the compact point.

    NOT IN FRAME

    Transbasin diversions that leave the basin before any gage counts them toward the river's own ledger.

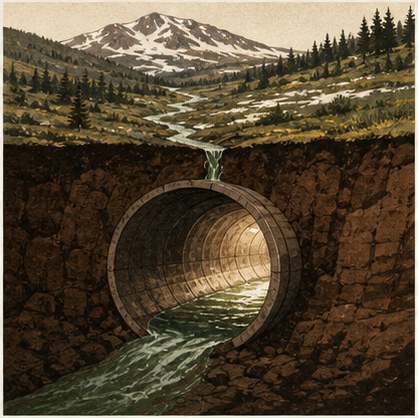
  4. Screen-printed panel: a cutaway of a transbasin diversion — water pouring from the mouth of a large concrete tunnel bored beneath a mountain meadow, carrying flow out of the basin under the Continental Divide.
    04 · SAN JUAN-CHAMA

    Handoff 04: The Upper Ledger

    Upper Basin consumptive use — and the New Mexico chapter. The San Juan-Chama Project moves Colorado River basin water under the Continental Divide into the Rio Grande. That is the water Albuquerque and Santa Fe drink. If you live in northern New Mexico, this river is your tap too.

    MODELED · method labelU.S. BUREAU OF RECLAMATION
    OBSERVED

    Modeled consumptive use by state, reconciled annually.

    REVEALS

    Where the Upper Basin's half of the compact actually goes.

    NOT IN FRAME

    Metered field-level use. Upper Basin consumptive use is estimated from crop and climate data, not measured — and the two basins do not agree on the method.

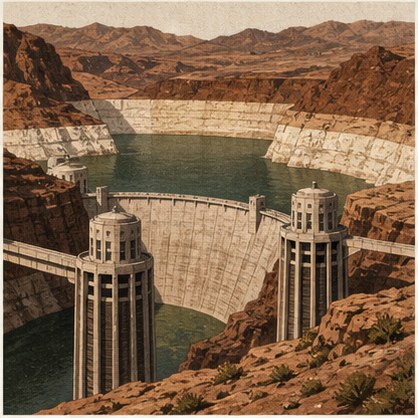
  5. Screen-printed panel: an arch dam wedged between canyon walls, its reservoir held behind it and a pale mineral bathtub ring banding the rock well above the current waterline.
    05 · POWELL

    Handoff 05: Powell

    Glen Canyon storage, and the plumbing problem underneath it.

    MEASURED · method labelU.S. BUREAU OF RECLAMATION
    OBSERVED

    Daily storage and pool elevation from Reclamation.

    REVEALS

    That below 3,490 feet the turbines stop, and the river outlet works were never designed to carry a full annual release indefinitely.

    NOT IN FRAME

    Sediment. The 2017 survey found the reservoir had lost storage capacity since it was built, and the losses continue every year.

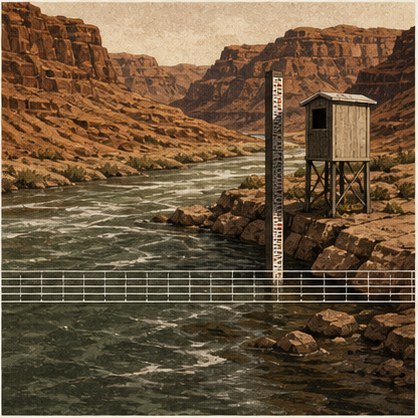
  6. Screen-printed panel: a stream-gaging station on a river below canyon walls — an instrument shelter on a tower beside a measuring cableway strung across the green water.
    06 · LEES FERRY

    Handoff 06: Lees Ferry

    The compact gage, seventeen miles below Glen Canyon Dam.

    MEASURED · method labelU.S. GEOLOGICAL SURVEY
    OBSERVED

    Discharge every 15 minutes, provisional until reviewed.

    REVEALS

    Where the ten-year rolling accounting between the basins is settled.

    NOT IN FRAME

    Natural flow. What the gage measures is a dam release. The natural-flow number the compact turns on is computed, not observed.

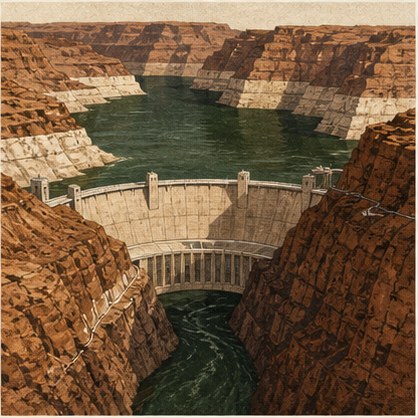
  7. Screen-printed panel: a concrete gravity dam with four tall cylindrical intake towers rising from a drawn-down reservoir, the bathtub ring bright on the surrounding desert rock.
    07 · MEAD

    Handoff 07: Mead

    Hoover Dam, the shortage tiers, and the straws Las Vegas drilled deeper as the lake fell.

    MEASURED · method labelU.S. BUREAU OF RECLAMATION
    OBSERVED

    Daily elevation, which is the trigger variable for Lower Basin delivery cuts.

    REVEALS

    That a single elevation reading determines how much water three states receive next year.

    NOT IN FRAME

    Groundwater. When surface deliveries are cut, pumping often backfills them, and none of that appears on this gage.

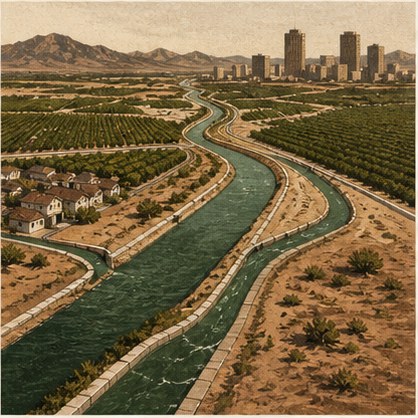
  8. Screen-printed panel: a lined canal carrying the river in a straight line through irrigated green fields and orchards toward a distant city skyline standing in dry desert.
    08 · LOWER BASIN

    Handoff 08: The Lower Ledger

    Imperial Valley, the Central Arizona Project, Las Vegas, Los Angeles, Phoenix, Tucson.

    PUBLIC RECORD · method labelCONGRESSIONAL RESEARCH SERVICE
    OBSERVED

    Annual deliveries by contractor, published in the water accounting reports.

    REVEALS

    That the great majority of consumptive use is agricultural, and a large share of that grows alfalfa and other forage.

    NOT IN FRAME

    The priority system's human consequences. Seniority decides who is cut first, and seniority is not distributed by need.

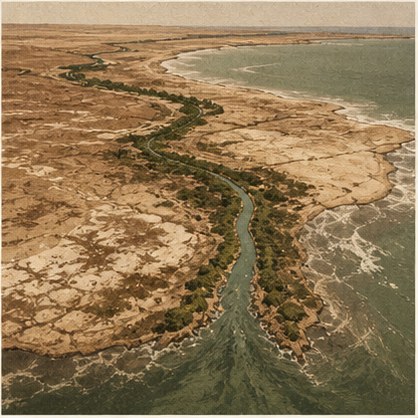
  9. Screen-printed panel: a cracked, salt-pale delta plain seen from above, thin remnant channels wandering across dried mudflats toward a hazy sea the main river no longer reaches.
    09 · DELTA

    Handoff 09: The Delta

    Mexico's 1.5 million acre-feet, the Minutes, and the estuary the river built and then abandoned.

    PUBLIC RECORD · method labelINTERNATIONAL BOUNDARY AND WATER COMMISSION
    OBSERVED

    Treaty deliveries at the border and the results of engineered pulse flows.

    REVEALS

    That the delta only receives water when someone deliberately sends it, and that the treaty framework governing it expires into the same post-2026 renegotiation.

    NOT IN FRAME

    An ecological baseline. Nobody measured the delta before it was dewatered, so recovery is being judged against an estimate.


07THE LAB

Balance the river.

Run the Powell and Mead system forward ten years on your own assumptions. The model is an annual mass balance built from Reclamation's own area-capacity tables, natural-flow record, and published operating thresholds. Play with it long enough and it will teach you something the totals hide.

Balance the river

PRESET SCENARIOS
3,700FULL POOL3,525DCP TARGET3,490MINIMUM POWER POOL3,370DEAD POOLLAKE POWELL3472 FT · 13% FULL3,5253,4903,370NOW+10 YRS
1,229FULL POOL1,090DCP CONTRIBUTION LINE1,075LEVEL 1 SHORTAGE1,050LEVEL 2 SHORTAGE1,025LEVEL 3 SHORTAGE1,000CONSULTATION LINE950MINIMUM POWER POOL895DEAD POOLLAKE MEAD988 FT · 14% FULL1,0901,0751,0501,0251,000950895NOW+10 YRS
ANNUAL SYSTEM BALANCE-0.55 MAFMEAN CHANGE IN COMBINED STORAGE PER YEAR
COMBINED STORAGE6.79 MAFFROM 12.29 MAF AT YEAR 0
FIRST THRESHOLD CROSSINGYEAR 3WITHIN THE 10-YEAR HORIZON
UNMET DEMAND0.00 MAFTOTAL ACROSS THE RUN

One good winter buys months, not years. Only demand bends the curve.

The interactive lab needs JavaScript. The table below is the same model's output for its three preset scenarios, computed at build time, so the result is readable either way.
SCENARIOSNOWPACKDEMAND MAF/YRPOWELL RELEASECOMBINED STORAGE NOWAFTER 10 YEARSCHANGEPOWELL FTMEAD FTUNMET DEMAND
BIG WINTER140% then 100%13.58.2312.29 MAF12.74 MAF+0.45 MAF351510510.00 MAF
THE GRIND100%13.58.2312.29 MAF6.79 MAF-5.49 MAF34729880.00 MAF
WORST ON RECORD45%13.57.4812.29 MAF0.00 MAF-12.29 MAF337089538.57 MAF
BEYOND THIS VIEW

This is an annual two-reservoir mass balance, and it is honest about being one. What it leaves out:

  • Monthly hydrology. Real operations are set month by month; this model steps one year at a time.
  • Equalization and balancing releases between Powell and Mead, which redistribute storage under rules this model replaces with a single release policy.
  • Intentionally Created Surplus and other conserved-water accounting, which lets users bank and later withdraw water.
  • Side inflows below Hoover Dam and the full network of Upper Basin reservoirs.
  • Bank storage, the water that moves in and out of reservoir shorelines and does not appear in a simple balance.
  • The stochastic hydrology ensembles Reclamation runs to express uncertainty; this model is deterministic given its inputs.

Initial conditions observed 2026-08-10. U.S. Bureau of Reclamation, Natural Flow and Salt Database, NaturalFlows1906-2020_20221215.xlsx, gage 09380000.

READ THE PROFESSIONAL-GRADE COUNTERPART · CRSS →

MODEL INPUTSU.S. BUREAU OF RECLAMATIONU.S. BUREAU OF RECLAMATIONU.S. BUREAU OF RECLAMATIONU.S. BUREAU OF RECLAMATION

08LIVING IMPACT

The map moves more than the total.

A reduction is a single number until you ask whose water it was. Five sectors absorb this river's shortfall, and the priority system — not need, not population — decides the order.

CITIES

40 million people, using less each year

Municipal use is the most visible share and one of the smallest. Las Vegas is the standard case study: return-flow credits mean water sent back to Mead is not charged against the allocation, and a third intake was drilled below the old ones so the city can keep drawing as the lake falls.

~20%OF CONSUMPTIVE USE IS MUNICIPAL AND INDUSTRIALPUBLIC RECORD · method labelCONGRESSIONAL RESEARCH SERVICE
AGRICULTURE

Where the real water is, and where real cuts land

5.5 million irrigated acres take the large majority of consumptive use, much of it for alfalfa and forage. The priority system decides the order: Imperial Valley holds some of the most senior rights on the river, so junior Central Arizona Project agriculture absorbs reductions first.

~70-80%OF CONSUMPTIVE USE IS AGRICULTURALPUBLIC RECORD · method labelCONGRESSIONAL RESEARCH SERVICE
TRIBES

The ledger's oldest unpaid line

Thirty federally recognized nations hold rights to a substantial share of the river's flow, much of it senior to every state compact under a doctrine the Supreme Court confirmed in 1908. Some of those rights remain unquantified; some are quantified but undeveloped. The 2026 negotiations again proceeded largely without tribes at the primary table.

REVIEW BEFORE PUBLISH · accuracy and tone pass required

MEXICO

1.5 million acre-feet, and a treaty in the same renegotiation

The 1944 treaty guarantees Mexico 1.5 MAF a year. Minute 323 and its successors added shortage sharing, storage rights in Mead, and the pulse-flow experiments that briefly reconnected the river to the sea. That framework expires into the post-2026 process alongside everything else.

THE RIVER ITSELF

A canyon ecosystem running on dam schedules

Below Glen Canyon the river runs cold and clear where it once ran warm and red. Sediment is trapped behind the dam, beaches erode, and native fish like the humpback chub hold on in tributaries. Experimental high-flow releases rebuild sandbars deliberately, on a schedule, because the river no longer does it itself.

NO ALLOCATION IS WRITTEN FOR THE RIVERPUBLIC RECORD · method labelU.S. BUREAU OF RECLAMATION
FIRST INTERVAL · 2027-2028
IMPERIALCAP AGCAP M&IMWDNEVADAMEXICOOTHER AZ▨ REDUCED    ▧ HELD

Shortages up to 1.5 MAF distributed under the Lower Division States' May 2026 proposal, with volumes beyond that assigned by priority. This is the reduction the basin has broadly agreed to absorb.

PUBLIC RECORD · method labelU.S. BUREAU OF RECLAMATION
SIDEBOARD · HELD IN RESERVE
IMPERIALCAP AGCAP M&IMWDNEVADAMEXICOOTHER AZ▨ REDUCED    ▧ HELD

The Preferred Alternative's outer bound reaches 3.6 MAF of Lower Basin shortage including assumed reductions to Mexico, distributed by priority. Same river, same total, a very different map of who pays.

PUBLIC RECORD · method labelU.S. BUREAU OF RECLAMATION

Distribution is the stronger result. The total tells you how much water disappears; only the distribution tells you whose water it was.

09EDGE OF THE MAP

What the ledger can’t see.

Five things this accounting system structurally cannot observe. The last one implicates every number on this page, including the headline.

01

Estimated, not measured

Upper Basin consumptive use is modeled from crop and climate data, not metered at the headgate. The two basins do not agree on the accounting method for the compact's own core number — and that disagreement is not academic, because it determines whether the Upper Basin is in compliance.

MODELED · method labelU.S. BUREAU OF RECLAMATION
02

The uncharged line

Evaporation and system losses in the Lower Basin run to roughly 1.5 million acre-feet a year — an entire Nevada-plus of water — and for most of a century they were assigned to no user's ledger at all. The post-2026 framework begins to charge them.

PUBLIC RECORD · method labelU.S. BUREAU OF RECLAMATION
03

The shadow supply

When surface deliveries are cut, groundwater pumping frequently backfills them. That water appears nowhere in the surface ledger, is largely unregulated in rural Arizona, and is being drawn from aquifers that recharge on geological timescales.

PUBLIC RECORD · method labelCONGRESSIONAL RESEARCH SERVICE
04

Promised and in use

Quantified but undeveloped tribal rights sit in the system as water simultaneously owed to nations and consumed by others. Every settlement that develops those rights makes the paper river smaller for everyone currently using them.

PUBLIC RECORD · method labelCONGRESSIONAL RESEARCH SERVICE
05

The modeled gage

Natural flow at Lees Ferry — the number this entire piece turns on, the number in our own headline — is a model output. It is observed flow back-corrected for upstream depletion and storage. Every allocation argument on this river rests on an estimate, including the ones we just made.

MODELED · method labelU.S. BUREAU OF RECLAMATION
10SOURCES

Trace any signal to its source.

Every number in sections 00 through 09 resolves to a card below. All of it is public; none of it is paywalled. That constraint is the product thesis, not a limitation.

U.S. BUREAU OF RECLAMATIONPost-2026 Colorado River Reservoir Operations · Final EIS

The decision document that replaces the 2007 Interim Guidelines: a 10-year adaptive framework for operating years 2027 through 2036.

PUBLIC RECORD
NOTICE OF AVAILABILITY JULY 31, 2026
U.S. BUREAU OF RECLAMATIONPost-2026 Final EIS · Executive Summary, Table ES-2

Operational sideboards for the Preferred Alternative: Powell releases 5.0-12.0 MAF, Lower Basin shortages up to 3.6 MAF, and the 2007 shortage volumes of 400/500/600 KAF at Mead 1,075/1,050/1,025 ft.

PUBLIC RECORD
JULY 2026
U.S. BUREAU OF RECLAMATIONPost-2026 Final EIS · Technical Appendix TA-3, Hydrologic Resources

Lake Mead and Lake Powell operating history, shortage declarations 2022-2025, the 1,090 ft DCP contribution line, and the lowering of Mead's minimum power pool from 1,050 ft to 950 ft.

PUBLIC RECORD
JULY 2026
U.S. BUREAU OF RECLAMATIONNatural Flow and Salt Database · Lees Ferry, gage 09380000

Observed flow back-corrected for upstream depletion and storage. The number this whole piece turns on is itself a model output.

MODELED
RECORD 1906-2020 · PUBLISHED DEC 15, 2022
U.S. BUREAU OF RECLAMATIONUpper Colorado Basin Region · Reservoir hydrodata service

Daily storage and pool elevation for Lake Powell (site 919) and Lake Mead (site 921). Supplies the model's initial conditions.

MEASURED
DAILY · PROVISIONAL
U.S. BUREAU OF RECLAMATIONRISE · Reclamation Information Sharing Environment API

Daily pool elevation and storage for Lake Powell (catalog items 508 and 509) and Lake Mead (6123 and 6124). This is the feed the live cards read in your browser; it cross-validates against the hydrodata service to the reported precision.

MEASURED
DAILY · PROVISIONAL
U.S. BUREAU OF RECLAMATIONLake Powell 2017 Area and Capacity Tables · TM ENV-2021-98

Elevation-area-capacity relationships from the reservoir floor at 3,130 ft to 3,712 ft. Rebased to live storage above dead pool for this model.

MEASURED
2017 BATHYMETRY + 2018 LIDAR · PUBLISHED JAN 2022
U.S. BUREAU OF RECLAMATIONLake Mead Area and Capacity Tables

Total capacity of 27,620 KAF between 895 ft and 1,229 ft; surface area 162,916 acres at full pool.

MEASURED
2001 BATHYMETRY + 2009 LIDAR · PUBLISHED SEPT 2011
U.S. GEOLOGICAL SURVEYWater Services · Colorado River at Lees Ferry, gage 09380000

Discharge at the compact point. This is regulated release from Glen Canyon Dam, not natural flow.

MEASURED
15-MINUTE · PROVISIONAL
USDA NATURAL RESOURCES CONSERVATION SERVICEAir and Water Database · SNOTEL, Upper Colorado basin SWE

Snow water equivalent as percent of median across roughly 200 Upper Basin sites. The reservoir before the reservoirs.

MEASURED
DAILY IN SEASON
NOAA COLORADO BASIN RIVER FORECAST CENTERSeasonal water supply forecasts

April-July unregulated inflow forecasts for Lake Powell, the number the basin watches each spring.

FORECAST
MONTHLY IN SEASON
NOAA PALEOCLIMATOLOGY / TREEFLOWMeko et al. 2007 · Medieval drought in the upper Colorado River Basin

Tree-ring reconstruction of annual water-year flow at Lees Ferry from 11 chronologies including remnant preserved wood. Geophysical Research Letters 34, L10705.

RECONSTRUCTED
RECONSTRUCTION 762-2005 CE
LAW OF THE RIVERColorado River Compact of 1922

Apportions 7.5 MAF/yr of beneficial consumptive use to each basin and sets the Lee Ferry accounting obligation of 75 MAF per rolling 10 years.

PUBLIC RECORD
SIGNED NOVEMBER 24, 1922
INTERNATIONAL BOUNDARY AND WATER COMMISSION1944 Water Treaty and subsequent Minutes

Guarantees Mexico 1.5 MAF/yr and, through the Minutes, sets shortage sharing and the delta pulse-flow experiments.

PUBLIC RECORD
TREATY 1944 · MINUTE 323 SIGNED 2017
CONGRESSIONAL RESEARCH SERVICEManagement of the Colorado River · Water Allocations, Drought, and the Federal Role

Standing congressional reference on the allocation framework, the priority system, and the federal role in shortage.

PUBLIC RECORD
REPORT R45546

PUBLISHED RESEARCHUdall & Overpeck 2017 · The twenty-first century Colorado River hot drought and implications for the future

Attributes roughly a third of the 2000-2014 flow deficit to higher temperatures and projects continued temperature-driven loss.

MODELED
WATER RESOURCES RESEARCH, 2017
PUBLISHED RESEARCHMilly & Dunne 2020 · Colorado River flow dwindles as warming-driven loss of reflective snow energizes evaporation

Finds a sensitivity of roughly 9.3 percent flow loss per degree C of warming, driven by snow-albedo feedback.

MODELED
SCIENCE, 2020
U.S. BUREAU OF RECLAMATIONColorado River Simulation System · model documentation

The professional-grade monthly model this annual mass balance deliberately is not. Read this to see everything the lab omits.

MODELED
FINAL EIS APPENDIX A, JULY 2026
CURRENTS 04 · THE COLORADO

Seven states. Thirty nations. Two countries. One ledger.

The river ends before the sea. Whether that stays true is being decided right now, in two-year intervals, under a framework published in July 2026 and running through 2036. Every number on this page came from a public record. So can the next one.

This ran on public data. Imagine it on yours.